← From AI-Centric to Orchestration-Native | PART 4 / 8
If you’ve been following this series, we’ve made three moves so far:
- Beyond ‘AI-centric’ – Intelligence inside individual tools is a start, but not enough.
- Orchestration-native – A coordination layer that listens, simulates, and acts across your enterprise.
- Economics of intelligence – Simulation-first design, agent-level visibility, and more rational execution bend the cost curve.
That naturally raises a harder question:
If we change how decisions are made, how should we measure whether the system is actually getting better?
Most enterprises are still instrumented for an older era – one where the primary job of systems was to record and report:
- OTIF (on-time, in-full)
- forecast accuracy
- inventory turns
- asset utilization
- cost per shipment, per order, per case
These aren’t bad metrics. They’re just partial. They were designed for siloed systems and human coordination. They tell you whether individual functions are performing, but not whether the system as a whole is healthy.
In an orchestration-native world, where agents continuously negotiate across demand, supply, and movement, you need a way to measure system fitness:
- Is flow reliable through the network?
- How well do we absorb shocks?
- Are we trading off profit, service, and carbon intentionally – or by accident?
- Can humans trust the decisions that digital agents are making?
To answer those, we lean on four families of metrics:
- Flow Fidelity
- Resilience Quotient
- Carbon-Adjusted Margin
- Trust Delta
Let’s unpack each one and how it complements – not replaces – your existing KPIs.
1. Flow Fidelity: are commitments actually flowing as intended?
Think of Flow Fidelity as a “rhythm” metric:
How often did flows move through the network as intended, within the windows we promised to ourselves and to our customers?
Remember our basic unit from i5 Transactional Grammar:
Product : Quantity : Place : Time
Each of those flows has a planned path and a time window (using Temporal Logic: no-sooner-than / no-later-than). Flow Fidelity asks:
- Did the product actually move along that path?
- Did it stay within the allowed time window?
- If it deviated, was the deviation within an approved alternative that the system had already considered?
Flow Fidelity can be expressed as:
- a percentage of flows that completed within their primary plan,
- plus a percentage that completed via pre-approved alternates (still “on plan,” just a different route),
- and a small remainder that required last-minute, unscripted interventions.
High Flow Fidelity means:
- fewer surprise expedites,
- fewer “where is my stuff?” escalations,
- and fewer meetings spent reconciling conflicting versions of reality.
You still care about OTIF – but Flow Fidelity gives you a leading indicator before those customer-facing outcomes break.
2. Resilience Quotient: what happens when the world moves?
Resilience isn’t just “did we survive the disruption?” It’s:
How gracefully did the system absorb the shock – and at what cost?
In an orchestration-native network, disruptions are just new inputs to the Dynamic Negotiation Graph:
- a port closure
- a carrier strike
- a sudden demand surge
- a capacity loss at a plant
The question is not whether disruptions will happen (they will), but:
- How many flows had to be re-routed?
- How quickly did agents find new feasible plans?
- How much additional cost and carbon did that introduce?
- How many Smart Agreements had to be renegotiated or broken?
A simple way to think about Resilience Quotient:
- Absorption: fraction of impacted flows that were re-planned automatically within policy.
- Penalty: incremental cost / carbon / delay caused by those re-plans.
- Escalation: fraction that required human override or emergency action.
Over time, you want to see:
- absorption going up,
- penalty trending down or stable,
- and escalations going down.
Traditional metrics only tell you “we had X disruptions and Y impact.” A Resilience Quotient tells you whether your orchestration layer is actually learning to handle volatility better over time.
3. Carbon-Adjusted Margin: profit that accounts for the real world
Most P&Ls still treat carbon as an externality or a separate sustainability dashboard: nice to have, sometimes regulatory, rarely central to day-to-day decisions.
An orchestration-native system can treat carbon as just another cost dimension in every negotiation between agents:
- mode choice (air vs ocean vs road vs rail)
- sourcing location (near-shore vs offshore)
- routing and consolidation strategies
That opens the door to Carbon-Adjusted Margin:
What is our margin after incorporating the cost (or shadow price) of carbon associated with our decisions?
You can:
- assign a carbon cost per unit of emissions,
- push that into the negotiation graph as a real constraint or objective,
- and measure how agents trade off margin vs carbon vs service.
This does three useful things:
- Gives leadership a single, comparable metric: “What’s our margin when we act as if carbon costs are real?”
- Lets you see which products, regions, or customers are most sensitive to carbon-aware decisions.
- Creates a direct link between sustainability targets and the daily decisions agents are making in the orchestration layer.
You still track gross margin and operating margin. Carbon-Adjusted Margin simply tells you whether you’re building a business that makes sense in a world where carbon has a price.
4. Trust Delta: how aligned are humans and digital agents?
As soon as digital agents start making or proposing decisions, a softer question becomes critical:
Do humans trust what the system is doing – and does the system behave in a way that deserves that trust?
We call this Trust Delta: the gap between what agents recommend or execute and what humans accept, approve, or override.
You can measure it at multiple levels:
- Decision-level:
- Of the proposals agents made, how many were accepted as-is?
- How many were modified?
- How many were rejected?
- Outcome-level:
- When humans overrode the system, were outcomes better or worse than the original agent plan?
- Over time, who is “winning” more often – humans or agents?
- Transparency-level:
- Were explanations and narratives clear enough for humans to understand why the system recommended what it did?
- How long did reviews and approvals take?
A healthy Trust Delta trend looks like:
- higher acceptance rates over time (as the system proves itself),
- fewer overrides needed to hit targets,
- and better explanations from the system when humans do intervene.
If Trust Delta is going the wrong way – lots of overrides, poor outcomes, confusion about rationale – that’s not a user problem. It’s a signal that your orchestration layer needs better policy, better training, or clearer governance.
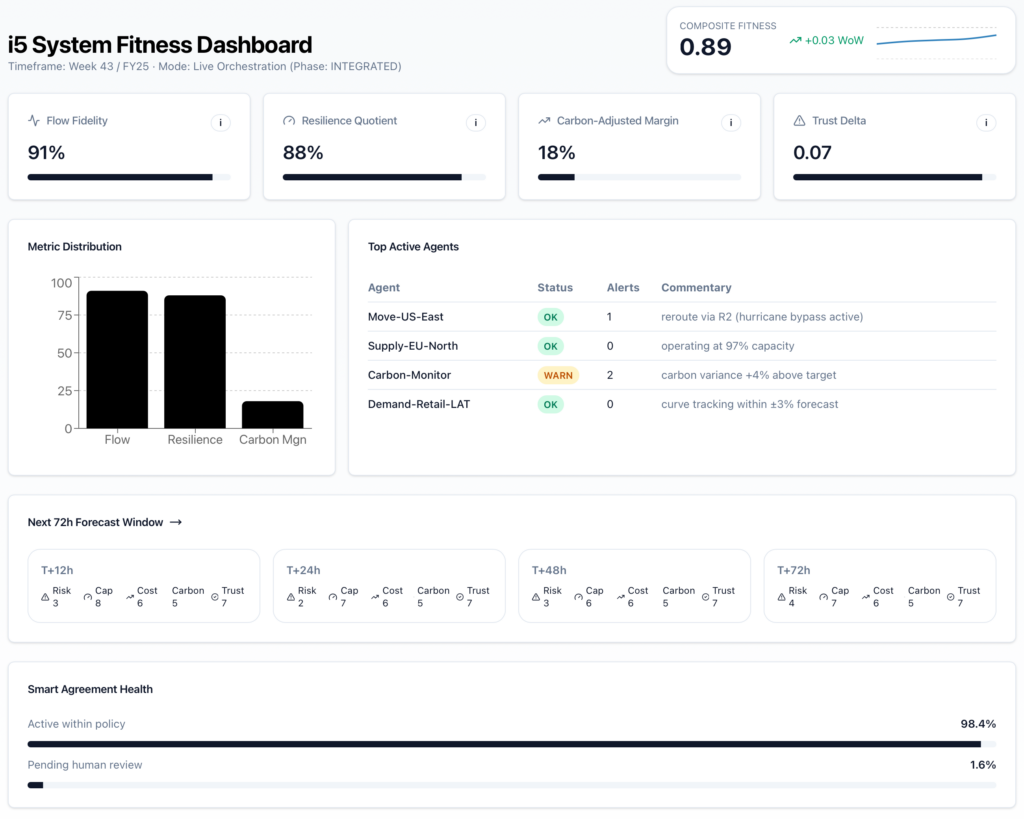
Putting it together: from silo KPIs to system fitness
None of these metrics tells the whole story on its own.
But together, they give you a system-level view that complements traditional KPIs:
- Flow Fidelity → “Is the network flowing the way we intended?”
- Resilience Quotient → “How do we behave under stress?”
- Carbon-Adjusted Margin → “Are we profitable in a carbon-constrained world?”
- Trust Delta → “Are humans and digital agents actually aligned?”
You still track:
- OTIF, lead times, cost per shipment, inventory turns, plant utilization.
What changes is the hierarchy:
- At the board / C-suite level, you look at system fitness: flow, resilience, carbon-adjusted economics, trust.
- At the functional level, you still manage with familiar KPIs – but now with context: how do local optimizations affect the whole?
In an orchestration-native enterprise, dashboards stop being rear-view mirrors and start becoming instrument panels: live views of how the system is behaving and where you can intervene to make it healthier.
NEXT: Adoption Without Disruption: A Practical Path to Orchestration →